Traffic Sign Recognition
The goals / steps of this project are the following:
- Load the data set (see below for links to the project data set)
- Explore, summarize and visualize the data set
- Pre-processing the input image
- rgb to gray
- normalized the image
- augmenting the dataset to make every classes of data has at least 800 images
- Design, train and test a model architecture
- LetNet
- Explore, other model architecture
- Use the model to make predictions on new images
- Analyze the softmax probabilities of the new images
- Summarize the results with a written report
Rubric Points
Here I will consider the rubric points individually and describe how I addressed each point in my implementation.
You're reading it! and here is a link to my project code
I read some codes and blogs before started my work:
1. Load data
# Load pickled data
import pickle
training_file = "./../data/train.p"
validation_file="./../data/valid.p"
testing_file = "./../data/test.p"
with open(training_file, mode='rb') as f:
    train = pickle.load(f)
with open(validation_file, mode='rb') as f:
    valid = pickle.load(f)
with open(testing_file, mode='rb') as f:
    test = pickle.load(f)

X_train, y_train = train['features'], train['labels']
X_valid, y_valid = valid['features'], valid['labels']
X_test, y_test = test['features'], test['labels']
2. Data Set Summary & Exploration
1. Provide a basic summary of the data set. In the code, the analysis should be done using python, numpy and/or pandas methods rather than hardcoding results manually.
I used the numpy library to calculate summary statistics of the traffic signs data set:
n_train = len(X_train)
n_validation = len(X_valid)
n_test = len(X_test)
image_shape = image_shape = X_train[0].shape
n_classes = len(np.unique(y_train))

print("Number of training examples =", n_train)
print("Number of validation examples =", n_validation)
print("Number of testing examples =", n_test)
print("Image data shape =", image_shape)
print("Number of classes =", n_classes)
- The size of training set is ? 34799
- The size of the validation set is ? 4410
- The size of test set is ? 12630
- The shape of a traffic sign image is ? (32, 32, 3)
- The number of unique classes/labels in the data set is ? 43
2. Include an exploratory visualization of the dataset.
Here is an exploratory visualization of the data set. It is a bar chart showing how the data ...
3. Pre-processing the input image
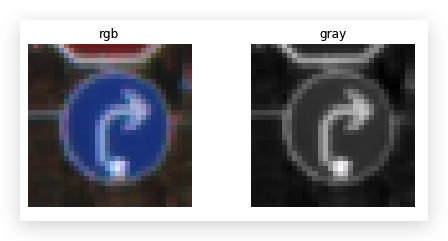
1. rgb to gray
As a first step, I decided to convert the images to grayscale because it helps to reduce training time.
I covert the RGB image to Gray scale by taking average of rgb value, as shown below.
X_train_rgb = X_train
X_train_gray = np.sum(X_train/3, axis=3, keepdims=True)
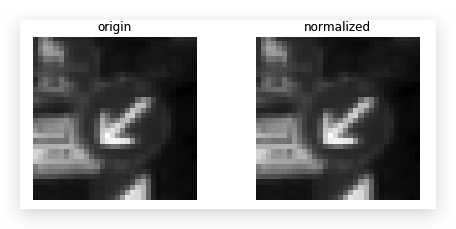
2. normalized the image
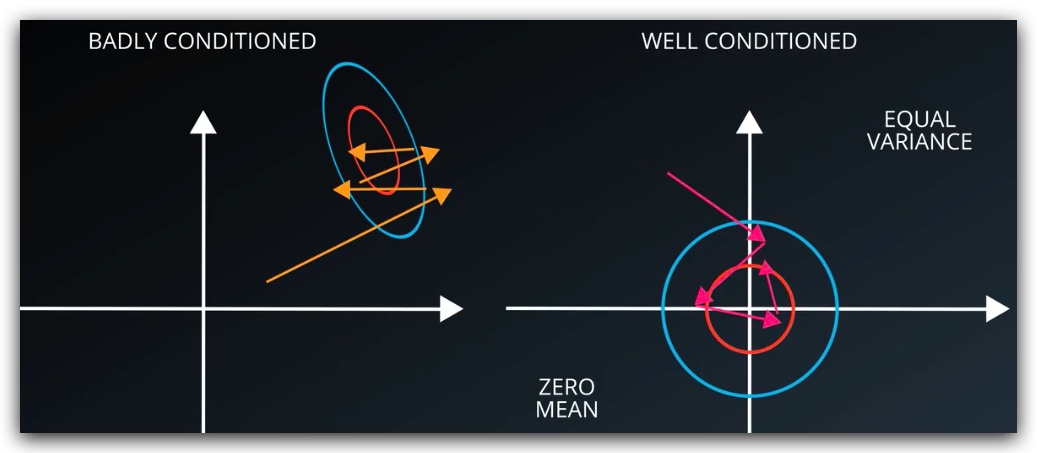 As the class suggest, the input should be equal variance and zero mean, so I normalized the input
X_train_norm = (X_train_gray - 128)/128
X_valid_norm = (X_valid_gray - 128)/128
X_test_norm = (X_test_gray - 128)/128
Original mean: 82.677589037
Normalized mean: -0.354081335648
Original shape: (34799, 32, 32, 1)
Normalized shape: (34799, 32, 32, 1)
3. augmenting the dataset to make every classes of data has at least 800 images
4. shuffle the data sets and split the validation sets
from sklearn.utils import shuffle
from sklearn.model_selection import train_test_split
X_train_norm, y_train = shuffle(X_train_norm, y_train)
X_train, X_validation, y_train, y_validation = train_test_split(X_train_norm, y_train,
                                                                test_size=0.20, random_state=42)
Old X_train size: 34799
New X_train size: 27839
X_validation size: 6960
using train_test_split from the sklearn.model_selection with ratio of 0.2 to take validation data sets.
4. Design and Test a Model Architecture
1. LeNet
1. Describe what your final model architecture looks like including model type, layers, layer sizes, connectivity, etc.) Consider including a diagram and/or table describing the final model.
| Layer | input | output | Description |
|---|---|---|---|
| Convolution-1 | 32x32x1 | 28x28x6 | |
| Activation-1 | 28x28x6 | 28x28x6 | RELU |
| Max pooling-1 | 28x28x6 | 14x14x6 | kernel = 2*2,stride =2 |
| Convolution-2 | 14x14x6 | 10x10x16 | kernel = 5*5 |
| Activation-2 | 10x10x16 | 10x10x16 | RELU |
| Max pooling2 | 10x10x16 | 5x5x16 | kernel = 2*2,stride =2 |
| Flatten | 5x5x16 | 400 | tf.contrib.layers.flatten |
| Fully connected-1 | 400 | 120 | tf.Variable(tf.truncated_normal(shape=(400, 120), mean = mu, stddev = sigma)) |
| Activation-3 | 120 | 120 | RELU |
| Fully connected-2 | 120 | 84 | tf.add(tf.matmul(x, W4), b4) |
| Activation-4 | 84 | 84 | RELU |
| Fully connected-3 | 84 | 43 | tf.add(tf.matmul(x, W5), b5) |
the final out put is 43 for 43 classes of the data sets
2. Describe how you trained your model. The discussion can include the type of optimizer, the batch size, number of epochs and any hyperparameters such as learning rate.
- Learning rate = 0.001
- EPOCHS = 60
- BATCH_SIZE = 100
- mu: 0
- sigma: 0.1
- dropout keep probability: 0.5
3. Describe the approach taken for finding a solution and getting the validation set accuracy to be at least 0.93. Include in the discussion the results on the training, validation and test sets and where in the code these were calculated. Your approach may have been an iterative process, in which case, outline the steps you took to get to the final solution and why you chose those steps. Perhaps your solution involved an already well known implementation or architecture. In this case, discuss why you think the architecture is suitable for the current problem.
| Pee-process | rate | epochs | batch | mu | sigma | drop_keep | Validation Accuracy | Test Accuracy |
|---|---|---|---|---|---|---|---|---|
| gray / normalized | 0.1 | 10 | 100 | 0 | 0.1 | 1 | 0.049 | 0.057 |
| gray / normalized | 0.01 | 10 | 100 | 0 | 0.1 | 1 | 0.949 | 0.886 |
| gray / normalized | 0.001 | 10 | 100 | 0 | 0.1 | 1 | 0.973 | 0.892 |
| gray / normalized | 0.001 | 50 | 100 | 0 | 0.1 | 1 | 0.99 | 0.922 |
| gray / normalized | 0.001 | 60 | 100 | 0 | 0.1 | 1 | 0.989 | 0.932 |
| gray / normalized | 0.001 | 50 | 100 | 0 | 0.1 | 0.5 | 0.948 | 0.881 |
| gray / normalized | 0.001 | 60 | 100 | 0 | 0.1 | 0.5 | 0.959 | 0.901 |
- if the accuracy up and down between epochs, I decreased the learning rate.
- epochs increased from 10 to 50-60.
- drop 50% wont helps to increase the accuracy.
2. Modified LeNet(from Traffic Sign Recognition with Multi-Scale Convolutional Networks)
1. Describe what your final model architecture looks like including model type, layers, layer sizes, connectivity, etc.) Consider including a diagram and/or table describing the final model.
| Layer | input | output | Description |
|---|---|---|---|
| Convolution-1 | 32x32x1 | 28x28x6 | |
| Activation-1 | 28x28x6 | 28x28x6 | RELU |
| Max pooling-1 | 28x28x6 | 14x14x6 | kernel = 2*2,stride =2 |
| Convolution-2 | 14x14x6 | 10x10x16 | kernel = 5*5 |
| Activation-2 | 10x10x16 | 10x10x16 | RELU |
| Max pooling2 | 10x10x16 | 5x5x16 | kernel = 2*2,stride =2 |
| Flatten_layer2 | 5x5x16 | 400 | tf.contrib.layers.flatten |
| Convolution-3 | 5x5x16 | 1x1x400 | 1x1 convolution |
| Flatten_layer3 | 1x1x400 | 400 | tf.contrib.layers.flatten |
| Flatten_layer2+Flatten_layer3 | 400+400 | 800 | tf.contrib.layers.flatten |
| Fully connected-1 | 800 | 43 | tf.Variable(tf.truncated_normal(shape=(400, 120), mean = mu, stddev = sigma)) |
2. Describe how you trained your model. The discussion can include the type of optimizer, the batch size, number of epochs and any hyperparameters such as learning rate.
- Learning rate = 0.0008
- EPOCHS = 60
- BATCH_SIZE = 100
- batch size: 100
- mu: 0
- sigma: 0.1
- dropout keep probability: 0.5
3. Tuning
| Pee-process | rate | epochs | batch | mu | sigma | drop_keep | Validation Accuracy | Test Accuracy |
|---|---|---|---|---|---|---|---|---|
| gray / normalized | 0.001 | 60 | 100 | 0 | 0.1 | 0.5 | 0.987 | 0.926 |
| gray / normalized | 0.001 | 60 | 100 | 0 | 0.1 | 1 | 0.969 | 0.892 |
| gray / normalized | 0.0005 | 60 | 100 | 0 | 0.1 | 1 | 0.989 | 0.911 |
| gray / normalized | 0.0008 | 60 | 100 | 0 | 0.1 | 0.5 | 0.984 | 0.92 |
My final model results were:
- validation set accuracy of ? Validation Accuracy = 0.984
- test set accuracy of ? Test Set Accuracy = 0.92
If an iterative approach was chosen:
Q: What was the first architecture that was tried and why was it chosen? A: Firstly , I chose to use LeNet as I learned from the class
Q: What were some problems with the initial architecture? A: The accuracy can not reach 94%+
Q: How was the architecture adjusted and why was it adjusted? A: I didnt
Q: Typical adjustments could include choosing a different model architecture, adding or taking away layers (pooling, dropout, convolution, etc), using an activation function or changing the activation function. One common justification for adjusting an architecture would be due to overfitting or underfitting. A high accuracy on the training set but low accuracy on the validation set indicates over fitting; a low accuracy on both sets indicates under fitting.
Q: Which parameters were tuned? How were they adjusted and why? A: if the accuracy up and down between epochs, I decreased the learning rate. epochs increased from 10 to 50-60.
Q: What are some of the important design choices and why were they chosen? For example, why might a convolution layer work well with this problem? How might a dropout layer help with creating a successful model?
If a well known architecture was chosen: Q: What architecture was chosen? A: module described in Traffic Sign Recognition with Multi-Scale Convolutional Networks
Q: Why did you believe it would be relevant to the traffic sign application? **A: Its desgined for traffic sign secognition **
Q: How does the final model's accuracy on the training, validation and test set provide evidence that the model is working well? A: Not very well, I think I need more training dataValidation Accuracy = 0.984Test Set Accuracy = 0.92
5. Test a Model on New Images
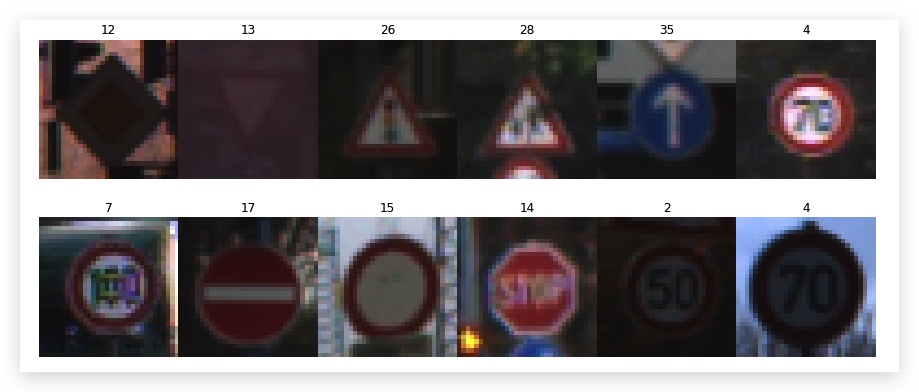
1. Choose eight German traffic signs found on the web and provide them in the report. For each image, discuss what quality or qualities might be difficult to classify.
Here are height German traffic signs that I found on the web:
fig, axs = plt.subplots(2,4, figsize=(16, 6))
fig.subplots_adjust(hspace = .2, wspace=.001)
axs = axs.ravel()
new_images = []

for i, img in enumerate(glob.glob('./new_test_image/*.ppm')):
    image = cv2.imread(img)
    axs[i].axis('off')
    axs[i].imshow(cv2.cvtColor(image, cv2.COLOR_BGR2RGB))
    # should be the same dim otherwise asarray can not combine them as a 4-dim array
    image=cv2.resize(image,(32,32))
    new_images.append(image)

new_images = np.asarray(new_images)
new_images_gry = np.sum(new_images/3, axis=3, keepdims=True)
new_images_norm = (new_images_gray - 128)/128
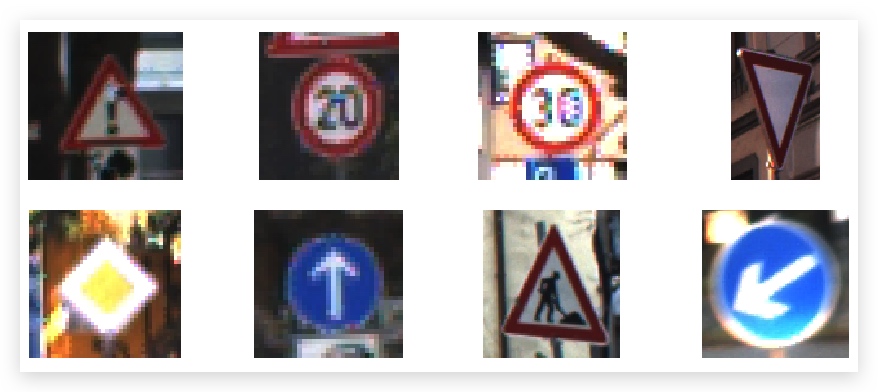
The first image might be difficult to classify because it looks very like traffic sign.
2. Discuss the model's predictions on these new traffic signs and compare the results to predicting on the test set. At a minimum, discuss what the predictions were, the accuracy on these new predictions, and compare the accuracy to the accuracy on the test set (OPTIONAL: Discuss the results in more detail as described in the "Stand Out Suggestions" part of the rubric).
with tf.Session() as sess:
    sess.run(tf.global_variables_initializer())
    saver = tf.train.import_meta_graph('./lenet.meta')
    saver.restore(sess, "./lenet")
    result_logits = sess.run(logits, feed_dict={x: new_images_norm, keep_prob: 0.5})
    # get the argmax of result_logits which is the predict
    predicts = sess.run(tf.argmax(result_logits, 1))
    fig,axes = plt.subplots(2,4,figsize=(16,6))
    axes = axes.ravel() # 必须将axes展开,否则不能直接赋值
    for i,p in enumerate(predicts):
        axes[i].imshow(cv2.cvtColor(new_images[i], cv2.COLOR_BGR2RGB))
        axes[i].set_title("{0}:{1}".format(p,df.iloc[p,:]["SignName"]),fontsize=13)
        axes[i].axis("off")
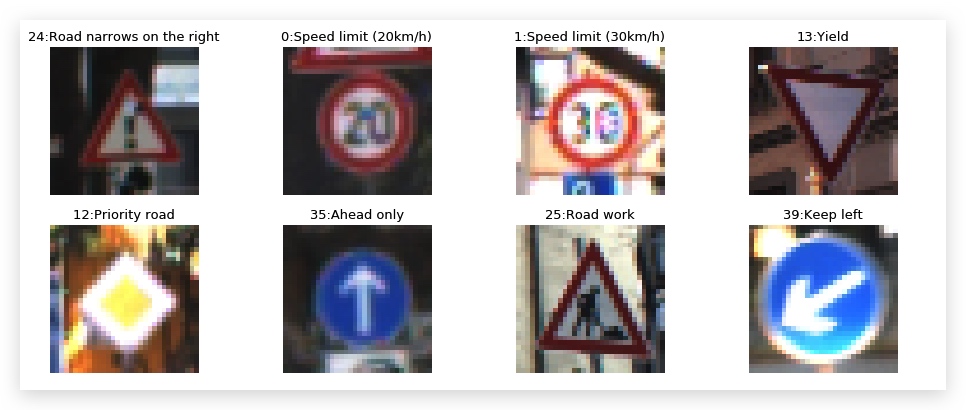
my_labels = [26, 0, 1, 13, 12, 35, 25, 39]

with tf.Session() as sess:
    sess.run(tf.global_variables_initializer())
    saver3 = tf.train.import_meta_graph('./lenet.meta')
    saver3.restore(sess, "./lenet")
    accuracy = evaluate(new_images_norm, my_labels)
    print("Test Set Accuracy = {:.3f}".format(accuracy))
INFO:tensorflow:Restoring parameters from ./lenet Test Set Accuracy = 0.875
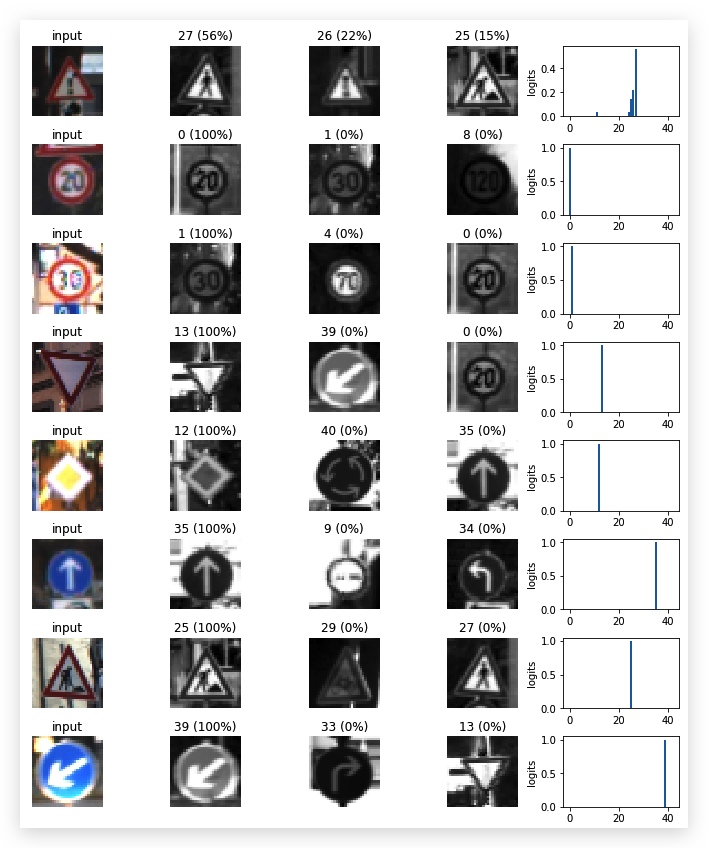
3. Describe how certain the model is when predicting on each of the height new images by looking at the softmax probabilities for each prediction. Provide the top 3 softmax probabilities for each image along with the sign type of each probability.
#define the operations
softmax_logits_op = tf.nn.softmax(logits)
top_k_op = tf.nn.top_k(softmax_logits, k=3)

with tf.Session() as sess:
    sess.run(tf.global_variables_initializer())
    saver = tf.train.import_meta_graph('./lenet.meta')
    saver.restore(sess, "./lenet")
    softmax_logits = sess.run(softmax_logits_op, feed_dict={x: new_images_norm, keep_prob:1})
    top_k = sess.run(top_k_op, feed_dict={x: new_images_norm, keep_prob: 1})
    fig, axs = plt.subplots(len(new_images_norm),5, figsize=(12, 14))
    fig.subplots_adjust(hspace = .4, wspace=.2)
    axs = axs.ravel()
    #print(top_k)
    #print(softmax_logits[0])
    #print(top_k[0][0]*100)

    for i, image in enumerate(new_images):
        axs[5*i].axis('off')
        axs[5*i].imshow(cv2.cvtColor(image, cv2.COLOR_BGR2RGB))
        axs[5*i].set_title('input')
        guess1 = top_k[1][i][0]
        index1 = np.argwhere(y_validation == guess1)[0]
        axs[5*i+1].axis('off')
        axs[5*i+1].imshow(X_validation[index1].squeeze(), cmap='gray')
        axs[5*i+1].set_title('{} ({:.0f}%)'.format(guess1, 100*top_k[0][i][0]))
        guess2 = top_k[1][i][1]
        index2 = np.argwhere(y_validation == guess2)[0]
        axs[5*i+2].axis('off')
        axs[5*i+2].imshow(X_validation[index2].squeeze(), cmap='gray')
        axs[5*i+2].set_title('{} ({:.0f}%)'.format(guess2, 100*top_k[0][i][1]))
        guess3 = top_k[1][i][2]
        index3 = np.argwhere(y_validation == guess3)[0]
        axs[5*i+3].axis('off')
        axs[5*i+3].imshow(X_validation[index3].squeeze(), cmap='gray')
        axs[5*i+3].set_title('{} ({:.0f}%)'.format(guess3, 100*top_k[0][i][2]))
        #print([logit for logit in softmax_logits[i]])
        axs[5*i+4].bar(np.arange(n_classes), [logit for logit in softmax_logits[i]])
        axs[5*i+4].set_ylabel('logits')
Question to be solved
- 自己手工构建两个模型
- 梳理步骤和手段
- 可视化
- 梳理涉及到的函数